Summary
In New Zealand, business valuation follows a structured process starting with the analysis of financial statements and the use of financial ratios to assess a company’s performance. Normalizing financial statements involves adjusting figures to exclude any unusual or one-time revenues or expenses, ensuring the resultant data reflects the sustainable and recurring profitability of the business.
The next step is to select the future benefit stream, usually net cash flow to invested capital.
The capitalization or discount rate, which has various methods of calculation, is critical for the income approach. A popular approach is the Build-Up Method which combines the risk-free rate, equity risk premium, size premium, industry risk premium, and company-specific risk premium. Subtracting a long-term sustainable growth rate from the discount rate provides the cap rate. The weighted average cost of capital (WACC) is used for invested capital, reflecting both equity and debt.
Valuation approaches include the asset approach (adjusted net asset method), the income approach (discounted cash flow and capitalization of earnings methods), and the market approach (private and public comps).
Then we need to adjust for control and marketability, commonly using discounts for lack of control (DLOC) and lack of marketability (DLOM). Having applied these discounts we have a the business equity value.
Find out more about Business Valuation Services.
Background
Back in the day, figuring out what a business was worth was often guesswork. People relied heavily on their intuition because there weren’t many specific guidelines to help. As the business world became more complex, with more people buying and selling businesses, it became necessary to have a more accurate way to value these companies. That’s why business valuation has transformed from an art to a mix of art and science with clear methods and standards.
So, while it might sound complex, business valuation is about combining real data with educated guesses to come up with the best estimate of what a wholesale business is worth. Whether it’s for buying a company, settling a legal matter, or preparing for tax time, understanding how valuation works is a key part of the business world.
Here’s the process a Certified Valuation Analyst (CVA) in New Zealand follows.
The Business Valuation Process
The Valuation Process
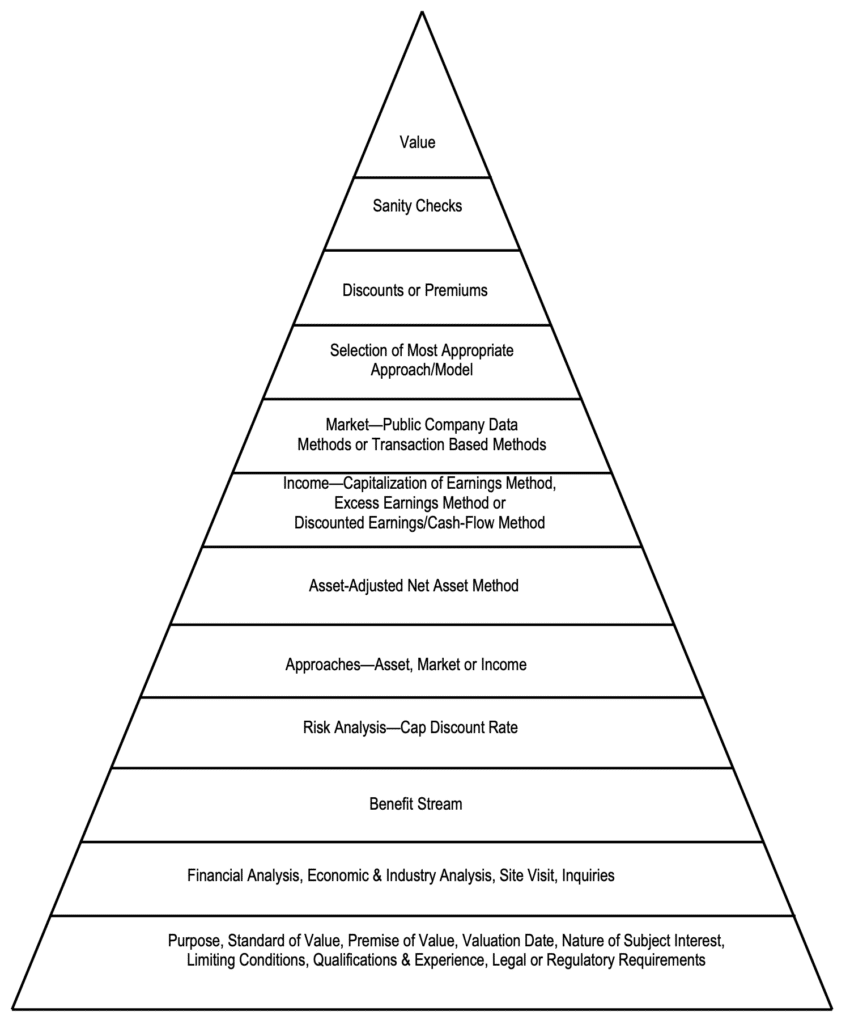
Source: NACVA, Fundamentals, Techniques & Theory, Chp 1 p.31
We start a the bottom and work our way to the top. We have to start at the bottom with the purpose because without the purpose we don’t know which valuation choices to make.
Financial Statement Analysis & Calculation of Financial Ratios
We start with an analysis of financial statements and the use of financial ratios to assess the company’s performance.
Financial Statement Analysis. The core of understanding a company’s financial health starts with an in-depth analysis of its financial statements—primarily the balance sheet, Profit & Loss statement, and cash flow statement.
1. P&L Analysis
– Revenue Streams
– Cost of Goods Sold
– Operating Expenses
2. Balance Sheet Examination:
– Current Assets and Liabilities, focuses on liquidity management.
– Long-term Assets and Liabilities, analysis includes assessing capital structure and financing strategies, such as the use of long-term debt and its impact on financial stability.
3. Cash Flow Statement:
– Operational Cash Flows, these reflect the actual cash generated from core business operations, crucial for meeting short-term obligations and funding inventory purchases.
– Investment and Financing Activities, reviewing cash flows from investment and financing provides insights into the company’s growth strategies and capital allocation.
 Financial Ratio Analysis. Employing financial ratios effectively can illuminate various facets of the company’s operational success and financial robustness:
1. Liquidity Ratios: Such as the current ratio and quick ratio, are fundamental in assessing the company’s ability to cover short-term liabilities with its current assets.
2. Profitability Ratios: Gross profit margin, operating margin, and net profit margin reveal how effectively the company is converting sales into profits. These ratios are indicative of pricing strategies, cost control, and overall operational efficiency.
3. Leverage Ratios: Debt-to-equity and times interest earned ratios provide insights into the company’s use of debt and its ability to meet interest obligations.
4. Efficiency Ratios: Inventory turnover, receivables turnover, and payables turnover are particularly pertinent for a wholesale company. These ratios help evaluate how effectively the company manages its inventory, collects receivables, and pays suppliers.
Generating Economic/Normalized Financial Statements
Normalizing financial statements involves adjusting the figures to exclude any unusual or one-time revenues or expenses, ensuring that the resultant financial data truly reflects the sustainable and recurring profitability of the business.
These adjustments could involve removing profits or losses from non-core activities, such as the sale of an asset or an unusual lawsuit settlement. This process helps in creating a clearer picture of the company’s operational performance by focusing on core, operational revenue and expenses.
Normalization also extends to the balance sheet, where assets and liabilities might be adjusted to fair value.
Here are some examples:
– shareholder loans may be netted out against shareholder equity
– check for obsolete or excessive inventory, and convert to LIFO from FIFO
– adjust materially large fixed assets to market value, take out real estate and include rent in the P&L
– check for operating versus capital leases
– remove non-operating assets
– consider adding unearned revenue to cash
– remove all non-operating revenue
– ensure the shareholder salaries are at market rates
– remove all private expenses and non-working family salaries
Note below in net cash flow calculations we add back non-cash charges such as depreciation but we subtract capital expenditures necessary to support projected operations.
The goal is to provide a financial statement that, as much as possible, can be used to predict future operational results and cash flows and compare to industry benchmarks.
Defining and Estimating the Future Benefit Stream
Now it’s time to select the future benefit stream. Generally, this is used in the income method using the Capitalisation or Discounted Earnings Methods and we will focus on these. When using other methods then other benefit stream types may be more appropriate e.g. NPAT for excess earnings or EBITDA for market multiples.
The general preference of a future benefit stream is to use “net cash flow” rather than an earnings figure such as Net Profit After Tax (or net income in American parlance). This is what investors use, what information sources provide, and includes balance sheet changes not just the P&L. We could end up using other earnings figures, e.g.operating profit, if they are more stable and reliable.
There are two net cash flow definitions you can use.
Net Cash Flow to Equity considers the cash flows available to equity holders after all operational costs, expenses, and debts are accounted for. The calculation is:
NPAT
+ Non-cash charges (e.g., depreciation, amortization, deferred revenue, deferred taxes)
– Capital expenditures necessary to support projected operations
–(+) Additions (deletions) to net working capital necessary to support projected operations
+ Changes in long-term debt from borrowings necessary to support projected operations
– Changes in long-term debt for repayments necessary to support projected operations
= Net cash flow to equity
(Note in the case of preferred shareholders then dividends to them would also need to be subtracted).
This is distinct from Net Cash Flow to Invested Capital, which considers cash flows available to both debt and equity holders, providing a comprehensive view of the business’s financial health. The calculation is:
NPAT
+ Non-cash charges (e.g., depreciation, amortization, deferred revenue, deferred taxes)
– Capital expenditures necessary to support projected operations
–(+) Additions (deletions) to net working capital necessary to support projected operations
+ Interest expense net of the tax benefit resulting from interest as a tax-deductible expense
= Net cash flow to invested capital (after-tax)
Note:
– Capital to support projected operations only. If more capital is needed to support future benefit streams, e.g. for growth, then this must also be subtracted.
– Identifying the correct discount rates is critical for discounting future cash flows accurately. When discounting net cash flow to equity, the appropriate discount rate is the cost of equity. When discounting net cash flow to invested capital, the appropriate discount rate is the weighted average cost of capital (WACC).
– We need to ensure we are using after-tax rates with after-tax earnings, or pre-tax rates with pre-tax earnings. We can use either we just need to be consistent in the methods we are using e.g. capitalisation value equals after-tax benefit divided by the after-tax cap rate.
– We don’t use the expression free cash flow, the cash available for discretionary uses, due to the lack of clarity on the definition.
Generally, we use Net Cash Flow to Invested Capital.
The historical earnings approach bases the valuation on historical financial performance, assuming past trends in profitability and growth will continue, adjusted for foreseeable changes in the business environment. It is suitable for businesses with consistent earnings and stable markets. We expect the benefit stream to be linear, to grow/decline at a constant rate.
Historical earnings are collected for the last business cycle (probably 5 years) and are then either a weighted or unweighted average is calculated to come up with a single earnings figure for use in the capitalisation method. If there is no apparent pattern or trend then an unweighted average is used. If there is a pattern or trend then years, probably the latest, are weighted more in the weighted average calculation.
Projected earnings look ahead, considering forecasts and strategic plans to estimate future earnings. This method is vital when changes in operations, market conditions, or business strategies are expected to significantly influence future earnings, requiring a dynamic assessment of the business’s potential. We expect the benefit to be non-linear, the benefit stream is projected to grow/decline at a variable rate.
The company would provide project net cash flow. This is carefully considered by the analyst, if it’s too aggressive then the analyst may increase the discount rate to account for the greater risk in the projections.
Non-linear projections accommodate varying growth rates, recognizing the realities of businesses that may experience fluctuations due to seasonal or cyclical factors. This leads to us choosing the Discounted Earnings Method (aka DCF) so we can account for these changes.
Example
NPAT $1,000,000
+ Non-cash charges $250,000
– Capex 500,000
– NWC $250,000
+ Interest $100,000
= Net cash flow to invested capital (after-tax) $600,000
Capitalization/Discount Rates
This is the most difficult and contentious part of a business valuation, the capitalisation or discount rate. There are several ways to do this including Modified CAPM, Build-Up Method, Modified Build Up, Excess Earnings, various market multiple approaches (e.g. P/E ratio and EPS), and various business risk build-up methods (e.g. Schilt, RRCM and Black/Green). We will discuss the Build-Up Method below.
Many factors make up a final discount or capitalisation rate. They can be internal to the company, the external environment, and the investment market. However there is no agreed or practical way to quantify the rate, as you’ll see below you can get some of the way with economic data but the last leg, company-specific risk, remains a subjective call.
Build-Up Method Components
1. Risk-free rate. The process begins with the risk-free rate, derived from long-term government bonds, which forms the baseline for safer investments.
To this, several premiums are added to account for various risks associated with the specific business and its environment.
2. Equity Risk Premium. This compensates for the risk of investing in the stock market over a risk-free government bond. It reflects the extra return investors demand for choosing equities, a more volatile investment.
3. Size Premium. Smaller companies, like many in the wholesale sector, typically exhibit higher risk due to factors like market access, capital constraints, and less diversified product lines. A size premium accounts for the increased risk associated with smaller firms’ potential for higher volatility and lower liquidity.
4. Industry Risk Premium. Each industry carries its own set of risks. An industry risk premium adjusts for the unique risks faced by companies within the sector.
5. Company-Specific Risk Premium. This is often the most subjective adjustment and considers risks such as the company’s operational effectiveness, management quality, and market position.
The sources for these are from industry publications (or a Google search), except for the last one which requires a careful but subjective opinion.
For example:
Risk-free rate 5.00%
+ ERP 7.50%
+ Size Premium 3.5%
+ Industry Risk Premium 0.50%
+ Company-Specific Risk Premium 5.00%
= After-tax net cash flow to equity discount rate 21.5%
This discount rate is the rate of return used to convert a cash flow into present value.
We have one more step to find the cap rate.
Cap rate and growth rate
The cap rate is the rate used to convert the benefit stream into a single period of value. We subtract a long-term sustainable growth rate from the discount rate to get the cap rate.
The long-term sustainable growth rate is inflation plus population growth generally about 2%-4%. It does not include any growth from future capital investment. If future capex for future growth is a factor then a Discounted Cash Flow method should be used not the single period cap rate method.
After-tax net cash flow to equity discount rate 21.5%
less growth rate 3.00%
= After-tax net cash flow to equity capitalisation rate for next year 18.5%
Note “for next year”, the net cash flow needs to be for the same period, which is probably the current year. Therefore we reduce that cap rate by the amount of growth:
After-tax net cash flow to equity capitalisation rate for next year 18.5%
/ 1 + growth rate or 1.03
= After-tax net cash flow to equity capitalisation rate for current year 17.96%
There we have the cap rate we’ll use for the capitalisation method below, the after-tax net cash flow to equity capitalisation rate for current year.
If we are projecting earnings (DCF) then we will use the after-tax net cash flow to equity discount rate as the discount rate, and the after-tax net cash flow to equity capitalisation rate for next year for the terminal value.
This calculation is for net cash flow to equity calculations, which is just for equity with debt being already paid off. What if we are using net cash flow to invested capital, that is for both equity and debt? Then we need to calculate WACC
WACC
WACC is the Weighted Average Cost of Capital. It is the rate we use for invested capital, weighted for the market value of both equity and debt, the total business value if you like, not just the value of shareholder’s equity but also the other capital partner debt.
We’ve got the cost of equity from above, 17.96%. The cost of debt is generally the debt interest rate less the tax benefit of interest expense.
WACC = (Cost of equity * equity % of capital structure) + ( cost of debt * (1 – tax rate) * debt % of capital structure)
Let’s say interest is 10%, tax rate is 28%. The cost of debt is 7.2%.
Debt is 20% of capital structure with equity 80%.
WACC
= (17.96% * 80%)+(7.2% * 20%)
= 14.37%+1.44%
= 15.81%
The equity and debt need to be at market value, not book value. Given it’s likely you have equity book value only, it may require equity value to be estimated in an iterative process (beyond this article).
Commonly Used Methods of Valuation
The most commonly used approaches are Asset, Income, Market and Other.
The asset approach is really about one method, Adjusted Net Asset. The book value of assets is inappropriate, accounting never intended for the cost of assets to be their current market value, only its historical cost.
The income approach is the classic method of taking the sum of the future benefit stream and discounting it by risk. It includes the well-known Discounted (Earnings) Cash Flow Method, and the Capitisation of (Earnings) Cash Flow Method.
The market approach is the conceptually easiest method of finding a comparable company transaction and applying a ratio to the subject company, sort of like real estate appraisal.
Assets Approach: Adjusted Net Assets Method
This method adjusts the assets and liabilities to their fair market values. This method often provides a floor value, the lowest value for the business. It can also be seen as a ‘liquidation’ value, which is the net cash that would be received if all assets were sold and liabilities settled either in an orderly manner or fire sale.
Adjustments are made to the balance sheet to calculate fair market value for each line. Here are some examples (overlaps with normalisation):
– check for obsolete or excessive inventory, convert to LIFO from FIFO
– adjust materially large fixed assets to market value, take out real estate and include rent in the P&L
– remove non-operating and personal assets including related debt
– write off bad debt
Income Approach: Capitalization and Discounted Earnings Methods
The income approach is centred around the future earning potential of a company. It has two well-used methods.
Capitalization of Earnings Method
This method is ideal when a business shows stable and predictable earnings, making it suitable for mature companies. The future benefit stream is normalized for any non-recurring revenues or expenses, and a capitalization rate is applied to arrive at the present value.
Value = benefit stream/risk = net cash flow to equity for current year / after-tax net cash flow to equity capitalisation rate for current year
The net cash flow and the cap rate have to be either pre-tax or after-tax. You can use it as the benefit stream operating profit, NPBT or NPAT but then you’ll need to adjust the cap rate to be an earnings cap rate rather than a net cash flow cap rate (by a “Cash to Earnings factor” beyond this article).
Discounted Earnings Method (Discounted Cash Flow)
Used when future earnings are expected to vary significantly in non-linear growth or decline. This method involves:
– forecasting net cash flow over a period of years
– when the net cash flow growth becomes stable, calculate a terminal value in that stable year
– discount the net cash flow and terminal value back to the present value using a discount rate
– sum the discounted cash flows and terminal value.
I assume you’ll use net cash flow to invested capital not net cash flow to equity. The difference is important because if you want to invested capital you will use WACC, whereas, to equity, you use the cost of equity cap rate alone.
The terminal value formula is part of the Two-Stage Gordon Growth model
= Cash Flow for the terminal year, times the growth rate /the after-tax net cash flow to equity capitalisation rate for next year. Remember this terminal value is also discounted.
If the business owner can access cash throughout the year, not just at the end of the year then we may apply a mid-point discount (beyond this article).
Market Approach: Completed Transactions and Guideline Public Company Methods
The market approach to valuation fundamentally relies on the idea that the value of a business can be determined based on the trading prices of comparable companies or recent transaction prices of similar businesses. There are a couple of different methods that can be used: the Completed Transactions and the Guideline Public Company.
Like usual the subject company’s financials are normalised as a first step.
Completed Transactions Method (Private Comparable)
This technique entails examining the prices paid for similar companies in recent transactions. A multiple is calculated from these transactions, usually MVIC*/Revenue and MVIC/EBITDA or EBIT. Then that same multiple is applied to the subject company to calculate a value—just like you see in a real estate appraisal. Adjustments are made e.g. for non-operating assets, and debt to arrive at equity value. It is usually a control value, not a minority value.
*Note Market Value of Invested Capital (MVIC) represents the total capital invested in a business: cash + operating assets + non-operating assets. Enterprise Value refers to the value of a company’s operating assets: debt + equity – cash – non-operating assets.
Transactions are found with data providers like MergerMarket, Pitchbook and Capital IQ.
There are some real problems with the Completed Transactions Method in practice.
Firstly, from my experience, they tend to only have information about public companies buying private/public companies because it’s reported to the stock exchanges. It is unlikely to have private-to-private sales, they’re kept confidential, and even the firms that represented their clients in these transactions cannot break their confidentiality agreements and provide that data.
Secondly, “similar” is the key word. The compared transaction companies should be similar—the same industry and similar companies. A rule of thumb is the 5/10/10 principle, transactions in the last 5 years (business cycle), where revenue was 10 times larger or smaller, and earnings were 10 times larger or smaller. And here’s the kicker, it should be in the same country.
If you’ve ever looked at transaction data, you’re going to be shaking your head. It is very hard to find that ‘similar’ in the US much less New Zealand. It’s unlikely to find similar private company comparables outside of some small business industries like cafes/restaurants or retail.
For mid-market and larger companies, you could make the argument that we can go outside of New Zealand and also include Australia. This opens it up a little but usually not enough.
Thirdly, the transaction is probably on an investment or synergistic basis, not on a fair market value basis. The buyer may have such strong synergistic benefits that they pay far more than fair market value. This might be acceptable for M&A or exit planning work but not for a valuation done on a fair market value basis.
Fourthly, key information may be hidden, especially the growth rate. If a comparable company growth rate is much higher than the subject company then the two may not be actually comparable.
Outside of a few industries, the market approach may only be a secondary check on value if done at all.
Guideline Public Company Method (Public Comparable)
This method compares the subject company to similar publicly listed companies. Unlike private transactions, public company information is available so can also be normalised. The share price at the date of valuation is used to calculate the multiples Price/Revenue, Price/EBITDA and Price/Earnings. The best multiple, the one with the closest fit, is then applied to the subject company.
There are some real problems with the Guideline Public Company Method in practice when valuing a private company. The biggest issue is the disparity in size, public companies can be so much larger that the comparison becomes tenuous or even ridiculous. Size can drive a multiple, and a billion-dollar company has a much higher value than a $10M company. Public companies tend to be more diversified in product and market, and have greater access to capital.
In summary, the market approach to business valuation provides a clear, market-validated perspective on the value of a business, but is very problematic for SME private businesses.
Prior Transactions
Note that if the company has had prior transactions of its shares, this is also a valid method to value the company under the market approach.
Other Approaches: Excess Earnings and Sanity Check method
The Excess Earnings method is the grandfather of valuation methods. It came out of the Prohibition Era when the US government agreed to compensate liquor companies for the value of their business. It essentially splits out the asset value and applies an industry rate of return. Then it subtracts this from a historical earnings figure, the remaining amount is deemed to be the earnings from the intangible part of the business. A cap rate is applied to this figure to come up with the business’ intangible value. The fair market value of net assets is determined and added to the intangible value. It is a hybrid income and asset method.
Sanity Check—Rule of Thumb. A quick and dirty approximation of value given by industry participants or brokers. A broker who has seen many transactions of cafes in a single year may be in a good position to comment on a subject company but this is rarely the situation. Most often you don’t know the terms of the deals, the amount of cash or earnout for example.
Sanity Check—Justification of Purchase. This method makes some assumptions about the financing of the deal, a buyer’s ROI, and the wage that a buyer will take. Then this is calculated to see if the debt can be serviced after wages and ROI.
Valuation Discounts and Premiums
Risk-averse investors value ownership attributes that reduce risk and discount those that increase it, so discounts and premiums are applied to reflect that risk. The most common adjustments are control and marketability, known as Discount for Lack of Control (DLOC) or Control Premium; and Discount for Lack of Marketability (DLOM).
No standardized levels or ranges exist for these adjustments, they must be determined case-by-case. In effect, they are applied because of imperfect data. There are often no greater discounts in the valuation process than seen at this stage.
Discount for Lack of Control (Minority Discount) is applied to minority interests that lack the power to influence business decisions. This discount is often significant and generally applied before marketability discounts.
Control premiums are added to the base value to reflect the additional value that controlling interests command. Control allows owners to influence company policy, management, and strategic decisions, which can enhance the business’s value. In effect, it is the inverse of DLOM.
Discount for Lack of Marketability (DLOM) reflects the reduced value of equity interests that cannot be easily converted to cash. This discount is significant for both controlling and minority interests but more pronounced for the latter.
Sometimes other discounts may be applied but the challenge is not to increase the discount rate for certain risks and provide a discount for the same risks at this stage of the process.
The correct approach is sequential, not additive. For example, if a 30% discount for lack of control and a 20% discount for lack of marketability are applied to an equity interest, the total discount is calculated multiplicatively, resulting in a combined discount of 44% rather than 50%.
Valuation analysts rely on empirical studies to support their adjustments. Notable studies include restricted stock studies and pre-IPO studies, which provide insights into the lack of marketability discounts based on historical data. These studies, however, must be applied with caution and supplemented with case-specific reasoning.
Several factors impact the applicability and size of discounts and premiums:
– Purpose of Valuation. Different contexts (e.g., estate planning, divorce settlements, ESOPs) require different considerations.
– Ownership Structure. Voting rights, transfer restrictions, and the size of the ownership block play significant roles.
– Company Characteristics. The company’s financial condition, management quality, and market conditions affect the valuation.
– Regulatory Environment. Federal and state regulations, including tax implications, influence the valuation process.
Example:
Net cash flow to invested capital (after-tax) $600,000
/ WACC 15.81%
= Value of business MVIC $3,795,070
+ Non-operating assets $204,930
= Value of business MVIC $4,000,000
– Debt $1,000,000
= Value of equity $3,000,000
Shares outstanding 100,000
Per Share Value $30.00
First Discount
Lack of control discount % (DLOC) 25%
Lack of control discount $7.50
Adjusted share value $22.50
Second Discount
Lack of Marketability Discount % (DLOM) 20%
Lack of Marketability discount $4.50
Adjusted share value $18.00
Number of shares valued 20,000
Value of 20% Equity $360,000
The value of the equity isn’t simply 20% of $3M or $600,000, it’s much less at $360,000 because of the DLOC and DLOM.
Summary
The process of business valuation is working your way up the triangle, carefully assessing each stage and finishing with a final equity value.
Find out more about Business Valuation Services.